|
■
Home ■ site map |
||||||||||||||||||||||||||||||||
|
|
BLOG: June 2010 - December 2013 II - Mammography 12. Mammography risks: False negativeFalse negative is the failure of screening to detect an existing breast cancer (BC). It can be hidden in the layers of overlapping tissue creating low-contrast area around it on the X-ray image. But omissions of the radiologists reading mammogram, or failure to follow proper procedure, are also often to blame for a false negative: in the Canadian trial, one of the most meticulously conducted, the estimated rate of undetected but "potentially detectable" breast cancers at the first screen was as high as 50% of the interval cancers in the following 12-month period, and 48% of the cancers detected at the 2nd screen (Sensitivity and specificity of first screen mammography in 15 NBSS centers, Baines et al. 1988). And, based on the actual data on the performance level of trial's mammography, it was up to existing standards, or better. This kind of screening negative are quite unusual to see published. Such negatives were routinely brushed under the rug. It is only that trial authors, quite unusually in the mammographic arena, but consistent with the scientific spirit, Hippocratic Oath and plain honesty, made all the relevant information - including negativities - available. Relatively rarely, false negative can also results from improper equipment performance, either due to inadequate setup, or malfunction. For some reason, not quite clear to me, screening's false negatives are generally considered the least of its risks, to the extent that are often entirely left out, even in some otherwise balanced reviews. Failure to detect an existing breast cancer defies the basic purpose of screening, and having that happening to 20-40% of screened women, or so, is clearly a piece of information that women invited to screening are entitled to know. Strictly talking, false negatives should not include fast growing true interval cancers (interval cancers are those diagnosed in between two subsequent screenings), which were either too small to form a recognizable structure, or even non-existent at the time of screening. However, since it is difficult to determine whether an interval cancer was present, or detectable at the time of screening, they all count as false negatives. That is acceptable since, as the numbers from Canadian study above imply, number of true interval cancers is mainly offset by the cancers detected at subsequent screening which could or should have been detected on the previous screen. The matters get more complicated by the presence of incident breast cancers - those diagnosed in a follow up period exceeding the length of inter-screening interval; that is, BC diagnosed in women who did not show for their next scheduled mammogram. It is often unclear how these BC are included in calculating false-negative rate; in general, randomized controlled trials tend to include all three - those detected by mammography, and those detected by other means (interval and incident BC) - into the true-positive category. Another variability factor possibly swaying the value of false-negative rate from one source to another is also related to the category of true-positive. By definition, it is the positive test result confirmed by diagnosis. But this figure routinely does not account for overdiagnosis - i.e. the fact that, approximately
up to 50%, or even more, of
diagnosed breast cancers are either a non-progressive or regressive growth that would not become symptomatic. That implies that the actual false negative rate is generally somewhat higher than the reported figure. The rate of false negative tests is not to be confused with test sensitivity. Both express the efficacy of mammography screening in detecting existing breast cancers, but in different ways. Table below defines these two indicators, as well as the rate of false positives and specificity.
TABLE 1: DEFINITION OF FALSE NEGATIVE AND FALSE POSITIVE RATE,
*commonly used in the context of screening mammography In screening mammography, the number of false negatives is much smaller than the number of women without disease (breast cancer), i.e. true negatives, simply because only a small number of women does have breast cancer. That makes its false negative rate, when calculated according to the standard definition, a very small number (typically about 1 in 1,000, or 0.1%). It makes this form of false negative rate inappropriate for mammography, and deceiving, because it does not show the most important test quality: the risk of a woman with BC to have it missed by the test. For that reason, the rate of false negatives (n) here should be based on the ratio between a number of false negative tests (FN) vs. number of screened women with breast cancer, i.e. as n=FN/(TP+FN), where TP stands for the true positive test result. Measured this way, according to the 2009 USPSTF figures, the false negative rate for mammography ranges from nearly 1 in 3 for the 40-49y age group to 1 in 7 for the 80-89y group. For the 40-69y group, the false negative rate for screening mammography is about 20%, or 1 in 5. This is the usually cited figure for the false negative rate for screening mammography, although as low as 10-15% is not uncommon (mainly in older sources). In the Malmo trial, there was 100 interval cancers in the total of 474 cancers detected among attendees (45-69y), for the 21% false negative rate over 9-year period. In the Canada trial, the false negative rate (40-59y, 5-year period) was 25%. These two numbers may not be directly comparable, or representative of the population at large, but they, at least roughly, imply that about 1 in 5 to 1 in 4 of the women who do have BC at the time of screening, will test negative. This number is significantly higher for women below 50y of age, where the rate of cancers missed by mammography screening in a 10-year period can approach 1 in 2. According to the US Preventive Services Task Force (USPSTF), the age-specific rate of false negatives over 10-year period is about 40% and 20% for women aged 40-49y ( 1 in 1,000, with 2.6 BC cases) and 50-69y, respectively (1.4 in 1,000, with 6.5 BC cases, Nelson et al. 2009). In other words, two out of five breast cancers are missed by mammography in the younger group, and one in five in the older group. False negative rate and sensitivity The difference between the rate of false negatives and sensitivity is that the former is determined as the proportion of false negative test results vs. all women with BC, while the latter is determined as the proportion of true positive test results vs. all women with BC. The former tells the odds of having your BC missed by screening, and the latter the odds of having it detected. The odds of having an existing BC detected with mammography (or any other) screening test, or sensitivity (s), as given in Table 5, are defined as s=TP/(TP+FN), i.e. ratio of all true positives vs. all tested women with breast cancer. It implies that, as a ratio number, it is directly related to the false negative rate n, as s=1-n (as ratio numbers; s=100-n for s and n in percents), or SENSITIVITY = 1 - FALSE-NEGATIVE RATE In other words, the higher false negative rate, the lower test sensitivity. The sum of true positives and false negatives - which makes the total of all women with BC - includes all interval cancers, both, those that were present at the time of screening and missed, and those that were not there (so called true interval cancers). Obviously, screening sensitivity is affected by the length of period between two screening sessions, and generally higher for longer screening intervals. Since the majority of breast cancers take years to develop, and relatively few grow much faster, or much slower than that, the sensitivity figure should be fairly close to that of the true detection efficiency, despite including all interval cancers. With n+s=1, the rate of false negatives is also directly related to test sensitivity as n=1-s. or FALSE-NEGATIVE RATE = 1 - SENSITIVITY (for n and s in %, n=100-s). And, as already mentioned, vice versa: SENSITIVITY = 1 - FALSE NEGATIVE RATE Consequently, both false-negative rate (n) and sensitivity (s) are in the 0 to 1 (or 0 to 100%) range, but we want false negatives rate to be as close to zero, and sensitivity as close to 1 (or 100%) as possible. Sensitivity of screening mammography is a figure most commonly used to present the efficacy of the test, and probably the one best understood by the layman. Because of that, it is important that it is accurate. Unfortunately - but not unexpected - there is is a heavy bias toward overrating mammography sensitivity in published sources and, consequently, in the input from practitioners. Most sources will quote 70-90%, and some are in the 60-95% range. The latter implies that mammography detects anywhere from 6 in 10 to 19 in 20 existing breast cancers. The available data, however, suggests that
mammography sensitivity can be
significantly lower For some it can be in the single digits. The problem is that the figures can vary significantly with different study populations, criteria and methodologies in using the data. Since there is no standardized approach, it leaves ample room not only for different results per se, but for biases as well, both unintentional and intentional. Some more recent U.S. studies indicate much lower sensitivity bottom for the screening mammography than what is usually cited: for women with dense breasts, it can be only 48% (Kolb et al. 2002, New York), while data from a large health maintenance organization in Seattle (WA) found sensitivity ranging from 80% among women with predominantly fatty breast, to as low as 30% among women with extremely dense breasts (Mandelson et al. 2000). Another study with women at higher risk or with dense breast found sensitivity range 33-46% (Irwig 2004, systematic review).
This drop in sensitivity for dense breast is significant because
large portion of women do have dense breasts. "Dense" are breast with 3
and 4 BI-RADS classification, i.e. heterogeneously and extremely
dense, respectively; 1 and 2, or fatty and scattered density,
respectively,
belong to "not dense". Table below is based on the
data from Lehman et al. (1999) and Titus-Ernstoff et al. (2006),
mutually fairly consistent.
In addition to breast density, it is the level of risk from getting BC - such as predisposing genetic mutation, family history, radiation to chest, and others - that is significantly affecting sensitivity of the X-ray mammography. In general, the higher risk, the lower sensitivity of X-ray mammography screening. For high-risk women, sensitivity is generally below 50%, and can drop to single digits ((25-59% Lord 2007, 30-45% Granader 2008, 37-41% Warner 2008, 20-50% Bermejo-Perez 2008, 2-87% Bigenwald 2008, 41% Hoogerbrugge 2008, 33/39% film/digital, Weinstein 2009, 17-54% Kuhl 2010)). It seems safe to conclude that, in general, the higher individual risk from BC, the lower sensitivity of mammographic screening. Discrepancies between studies with respect to mammography sensitivity figures are rather typical. For instance, in a recent study focused on younger women, published in the Journal of National Cancer Institute, screening sensitivity for 73,335 women aged 35-39y was found to be 76% (Performance of First Mammography Examination in Women Younger Than 40 Years, Yankaskas et al. 2010). Another study also using BCSC (the National Cancer Institute's Breast Cancer Surveillance Consortium) data found that sensitivity of mammography in the 30-39y age group was 63% and 54% for women with family history of BC, and 70% and 60% for those without it, for all BC and invasive alone, respectively (Kerlikowske et al. 2000). It is seemingly conflicting that this group of similar age has so much lower sensitivity vs. Yankaskas et al. but key difference, not emphasized in the latter study is that first mammography has generally significantly higher sensitivity than subsequent end periodic screenings. However, knowing that about half of the women in this age group have dense breasts suggests that even Kerlikowske's figures, let alone Yankaskas', are too optimistic, not representative of the actual sensitivity for this population. For illustration, if we assume that sensitivity for half of the women with dense breasts is 50% - and it could be somewhat less - the other half would need to average over 100% sensitivity for an overall 76% average in Yankaskas et al. Large Australian study on over 100,000 women aged 40-69y found that the sensitivity of mammographic screening also may vary significantly with woman's symptoms: it ranged from 81% to 76% and to 60% for women with significant symptoms (lump, nipple discharge), no symptoms, and other symptoms (breast pain, tenderness), respectively (Kavanagh et al. 2000). In the community setting, significant factor for the sensitivity level of screening mammography is the radiologist. Depending on its experience and actual procedures used, there is a range of at least 40% in the screening sensitivity of U.S. radiologists (Beam et al. 1996). This means that the +/- deviation from the overall average is about 20%, possibly more. Evidence of significant increase in the false-positive rate in the community settings (doubled from 1985 to 1993, Elmore et al. 2002)implicates that the overall sensitivity of screening mammography is also increasing. In other words, lowering the bar for declaring the test positive does result in more existing breast cancers detected, but inevitably increases the rate of false positives as well.
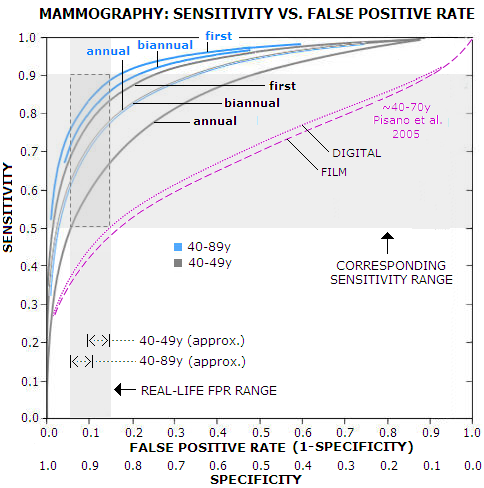
This, obviously, implies a correlation between the sensitivity and
false positive rate. It can be presented as receiver operator
curve (ROC), a curve fitted into empirical data. Graph below
is based on Yankaskas et al. (Association between Mammography
Timing and Measures of Screening
For the common practical range of the false positive rate, 5-15% (it can be less or more than that, but most of women will be within that range) the corresponding sensitivity is 50-65%, 60-77% and 68-83% for annual, biannual and first-time mammography, respectively, in the 40-49y age group, and 60-77%, 70-85% and 75-88%, in the same order, for all women, 40-89y. According to it, typical sensitivity for annual mammography in the 40-49y group - which according to the USPSTF has about 10% false positive rate - is nearly 60%. For all women, the USPSTF false positive rate average is around 8%, with the corresponding sensitivity range for annual mammography of 55% for 40-49y women, and 67% for all (40-89y) women. The 67% figure is significantly lower than ~80% overall average commonly cited. For that to happen, the graph implies that the false positive rate would have to be about 17% - more than double the USPSTF estimate. Even for biannual screening alone, it would have to be about 10% - more than the USPSTF overall figure. Obviously, we can't claim both: this low overall false positive rate, and ~80% overall mammography sensitivity. And, as the above look at the sensitivity figures in various studies suggests, the BCSC data used by Yankaskas et al. and also preferentially used by the USPSTF, are probably biased toward higher than actual sensitivity. For comparison, results from another study are plotted (magenta) showing ROC for digital vs. film mammography for 42,000 women screened on 33 sites in U.S. and Canada (Pisano et al. 2005). According to it, the overall sensitivity for the same range of false-positive rate is approximately in the 35-50% range. The authors noted lower sensitivity than in other studies, and offered that it is due to the longer period used for entering diagnosed cancers, 15 vs. usual 12 month after the screen. It hardly can explain this much of a difference (participants in this study didn't have a mammogram in previous 11 months, so their averaged status is somewhere between annual and biannual screening), but well illustrates both, the magnitude of discrepancy between results based on two different sources, and magnitude of bias possible by selecting specific methods and criteria. With evidently inconclusive, contradicting available data, the best we can do is to draw some general outlines for the sensitivity figures of X-ray mammography. For an individual woman, the actual figure for mammographic sensitivity depends mainly on her breast density, which is highly correlated to women's hormonal status: younger women, as well as those undergoing hormonal therapy, have generally denser breasts, and a higher risk of false negative. So, depending mainly on breast density and procedure, the actual U.S. screening sensitivity range for X-ray mammography, for the large majority of women, seems to be approximately between 1 in 3 (~33% sensitivity) and 9 in 10 (~90%) of the existing BC detected, with the overall average probably somewhere around 2 in 3. That is within the sensitivity range outlined by the large BC random controlled trials (although that figure itself - should we say expectedly - varies dramatically with the source, e.g. 74-88% Fletcher et al. 1993, 61-100% Laszlo Tabar's Organizing Committee Report 1996, 39-89% Shen and Zelen 2001). So, the overall average for screening sensitivity in the U.S. is, very approximately, between 60% and 70%. This still seems somewhat optimistic, considering that it is common knowledge that between 1/3 and 1/2 of all detected breast cancers in the screening programs are interval cancers, i.e. not detected by screening. Accordingly, the actual overall sensitivity of mammography screening is probably closer to 60%. In other words, in the real world, about 3 in 5 breast cancers are detected by the mammography screening. This is lower than what most women imagine, but it is well known and generally accepted fact. A recent study on nearly 600 breast cancer surgery patients found that only 57% of them had their cancer detected by screening (Palpable Presentation of Breast Cancer Persists in the Era of Screening Mammography, Mathis et al. 2010). The actual screening sensitivity is even lower, because sensitivity figures routinely do not account for overdiagnosis, i.e. the fact that roughly 1 in 4 to 1 in 3 of the cancers diagnosed through screening is not a malignancy. In other words, since some 20% to 33% of the "true positives" are not breast cancers, the sensitivity rate, expressed as true positives vs. all screened women with BC, i.e. sensitivity=(true positives)/(true positives + false negatives) is closer to 50% level, or 1 in 2. Flip the coin. Expectedly, due to a fewer number of interval cancers, screening sensitivity is somewhat higher with annual, as opposed to biannual screening. Also, it is significantly higher at the first (prevalent) screen, compared to subsequent (incident) screens. What has to be clearly stated, is that for the relatively small, but still significant number of women - particularly those with high BC risk and very dense breasts - mammography has very low sensitivity: anywhere from single digits to 20-30%. These women have every right to know that.
Follows more detailed overview of the rate of false
positives in screening mammography. YOUR BODY ┆ HEALTH RECIPE ┆ NUTRITION ┆ TOXINS ┆ SYMPTOMS |
|||||||||||||||||||||||||||||||