|
■
Home ■ site map |
healthknot.com |
||||||||||||||||||||||||||||||||||||||||||||||||||||||||||||||||||||||||||||||||||||||||||||||||||||||||||||||||||||||||||||||||||||||||||||||||||||||||||||||||||||||||||||||||||||||||||||||||||||||||||||||||||||||||||||||||||||||||||||||||||||||||||||||||||||||||||||||||||||||||||||||||||||||||||||||||||||||||||||||||||||||||
|
Health news:
May 2010
April 2010
Salt studies: the latest score
March 2010
February 2010
The MMR vaccine war: Wakefield vs. ? Wakefield proceedings: an exception?
Who's afraid of a littl' 1998 study?
January 2010
Physical activity benefits late-life health Healthier life for New Year's resolution
December 2009
Autism epidemic worsening: CDC report Rosuvastatin indication broadened
November 2009
Folic acid studies: message in a bottle? Sweet, short life on a sugary diet
October 2009
Smoking health hazards: no dose-response Asthma risk and waist size in women
September 2009
Antioxidants' melanoma risk: 4-fold or none? Murky waters of vitamin D status Is vitamin D deficiency hurting you?
August 2009
New gut test for children and adults Unhealthy habits - whistling past the graveyard?
July 2009
Asthma solution - between two opposites that don't attract Light wave therapy - how does it actually work?
Hodgkin's lymphoma in children: better
alternatives
June 2009
Hodgkin's, kids, and the abuse of power
Efficacy and safety of the
conventional treatment for Hodgkin's:
Long-term mortality and morbidity after
conventional treatments for pediatric Hodgkin's
May 2009
Late health effects of the toxicity of the conventional treatment for Hodgkin's Daniel's true 5-year chances with the conventional treatment for Hodgkin's Daniel Hauser Hodgkin's case: child protection or medical oppression?
April 2009
Protection from EMF: you're on your own EMF pollution battle: same old...
EMF
health threat and the politics of status quo
March 2009
Electromagnetic danger? No such thing, in our view...
February 2009
Electromagnetic spectrum: health connection Is power pollution making you sick?
January 2009
Pneumococcal vaccine for adults useless? DHA in brain development study - why not boys?
|
May 2010 Salt hypothesis and real worldSalt war Salt hypothesis Dahl/Intersalt Salt studies Is sodium bad? Real life Beyond salt Is our present salt consumption unhealthful excess? The answer to that question is. like an open book, lying in front of our eyes. Wide range of salt intake levels in different countries and regions makes it possible to identify any significant effect of it on blood pressure and cardiovascular health, and either prove or disprove salt hypothesis. All that is needed is to gather data, process it, and make the conclusion. Turns out, it is not quite as simple. There is so many variables affecting the figures - diet, lifestyle, genome, socio-economic situation, active policies - that it may be difficult to filter out the effect of any single factor. Data sources are often less than complete, or reliable. Surprisingly, after it's been in the hot focus for decades, this particularly applies to the data on salt intake. Not a few countries - including some highly developed - pay little or no attention to it. There is no accepted international standard for calculating salt intake figures, so even those that are available are not necessarily complete, or comparable (for instance, it is quite common to base salt intake figure on the estimate of salt content of foods taken home, without including salt added in cooking and at table). Despite that, the existing international database is a sufficient basis for testing the overall consistency of salt-hypothesis claims with the real life figures. Let's start tackling the complexity of determining the relation between salt intake, hypertension and cardiovascular disease on one of the most publicized turnarounds in cardiovascular mortality: the Finnish story. It is often cited as a real-life proof that reducing salt intake at the population level does produce significant benefit with respect to cardiovascular health. As we are about to see, it is an oversimplification at best, and may not be true at all. Initiated in 1971, in the Eastern Finnish region North Karelia, and expanded to all of Finland in 1976, the nationally coordinated program focused at what seemed to be the main culprits of the Finland's exorbitant cardiovascular death rates, among the worst in the world: � high cholesterol, � high blood pressure, and � high prevalence of smoking among Finnish men High cholesterol and hypertension rate were seen as a consequence of very high intake of saturated fats (primarily from dairy and pork products), high intake of salt and very low consumption of vegetables. So the program went after correcting these dietary patterns, along with an aggressive anti-smoking campaign. Three decades latter, Finland claims consumption of saturated fats lower by a third (21 to 14% of the caloric intake), and salt consumption lower by 38% (12.2 to 7.6g/day). Also, 40% lower rate of smoking in Finnish men (from 47% to 28%), but 17% higher in women (from 17% to 20%). These changes were followed by 11 mm Hg drop in the average blood pressure (both systolic and diastolic), 23% drop in serum cholesterol and, most importantly, the death rates for cardiovascular diseases (CVD) fell nearly 80%. This landslide in CVD mortality is credited to the reduction in traditional CVD risk factors: cholesterol level, blood pressure, salt intake and smoking. But is that fair assessment? For, you see, Finland's CVD hasn't gone anywhere; it is still there, affecting, in fact, more Fins than before - the consequence of higher rate of survival and no significant reduction in CVD incidence. It could be that the reduction in mortality has more to do with something else: better survival rates due to more effective immediate and post-treatments, and dietary changes other than saturated fat and cholesterol intake? Although Finland's officials claim significant dietary shift toward vegetable foods, that is not supported by the data. While sodium-to-potassium ratio did decline significantly, it is nearly entirely the result of lower salt intake. Potassium intake, measured by renal excretion, had actually slow but steady decline. And it is vegetables that supply bulk of potassium. Where the Fins' diet improved, is consumption of fruit, particularly berries. That and other source of antioxidants had likely contributed to lowering cholesterol and reducing blood pressure, as well as the increased intake of good fats, needed for proper function and protection of the cellular structures. But research data do not support that blood cholesterol level is significant predictor of CVD mortality anyway. No doubt, in addition to better treatment efficacy, it is significant reduction in rates of smoking and blood pressure, combined with overall improvement in the nutritional intake of Fins, that are to be credited for this major drop in CVD mortality rates. Why not the reduction in salt intake? While it is often presented as an important, even primary factor of the Finland's (partial) success, available data do not support this view. One such contradicting piece of information is the fact that CVD mortality plunged in a number of other countries, most of them without any appreciable changes in salt intake, much less a comprehensive CVD-focused strategy. Following table lists the most successful European countries in this respect, along with those that had the worst trend (bottom).
CHD=Coronary heart disease CHL=
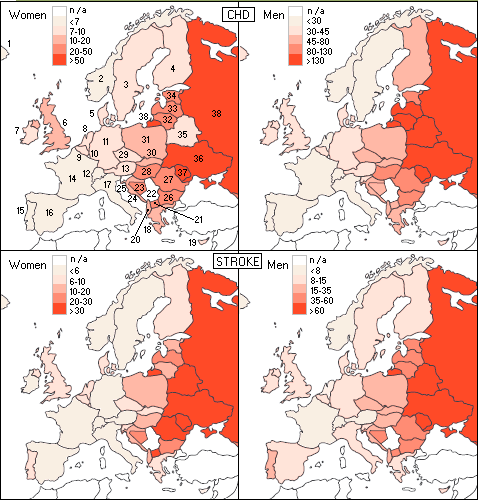
cholesterol W=Women M=Men Evidently, Finland's drop in CVD mortality rates is not really exceptional. Despite more than three decades of very dedicated public policy, and salt intake reduced to the lower end of the range for the 10 countries with the largest CVD mortality drop, its most recent rates of CVD deaths are among the worst in this group of countries, more than double that in Switzerland, and similar to those in U.K. It should be mentioned that, unlike the rest of European countries, many Fins use special sodium-reduced salt, enriched with potassium, magnesium and L-lysine-hydrochloride. This effectively further reduces their sodium intake, as well as its possible hypertensive effect (by lowering sodium/potassium ratio), while strengthening cardiovascular system (magnesium). We could fairly confidently consider Fins the least exposed to "harmful effects" of sodium, yet their CVD mortality and morbidity numbers are lagging well behind those in best ranked countries. The conventional CVD risk factors do not offer clear explanation for that fact. With respect to smoking, Finland has near-lowest incidence, sharing the third place with Switzerland; obesity-wise, it is in the lower half, but only three countries, Netherlands, Norway and Sweden, are more - and not much more - than one BMI point ahead; all but one country (UK) have lower mean systolic blood pressure than Fins, which, again does not support the notion of it being significantly influenced by salt intake; Finally, Finland is in the middle cholesterol-wise, and near the bottom (i.e. among the worst) in alcohol consumption. Alcohol? Neah... Fins consume 30% less of it than Luxembourg, which has more than twice lower CVD mortality rates. Maybe a look at the four countries with the highest CVD mortality rates can help figure out why Fins are still behind some countries that had nothing similar to the Fin's decades-long focused effort on winning over CVD? Surprisingly, despite the death rates in the worst-ranked countries being up to a dozen times higher, and raising at sometimes horrifying pace, their conventional CVD risk factors are not appreciably different than those in the 10 countries with the highest drop in mortality rates. The only exception is significantly higher proportion of men smoking. Belarus has somewhat more of obesity problem, and perhaps related to it higher blood pressure, but otherwise the risk factors in these countries are within the range of the best-ranked 10, with their total cholesterol being even appreciably lower. Of course, we do know that the total cholesterol "risk factor" was debunked quite a while ago. It is still dragging on in the official documents solely because of the manner in which the official structures tend to cling to their views despite evidence to the contrary, effectively making these views dogmas. So, what is causing the Eastern Europe's CVD onslaught? Seems as if the conventional CVD risk factors and associated numbers are only a part of the picture, and not the most important one. A look at the regional CVD-related maps may shed some more light on this puzzle. Let's first take the visual of the CHD and stroke mortality maps.
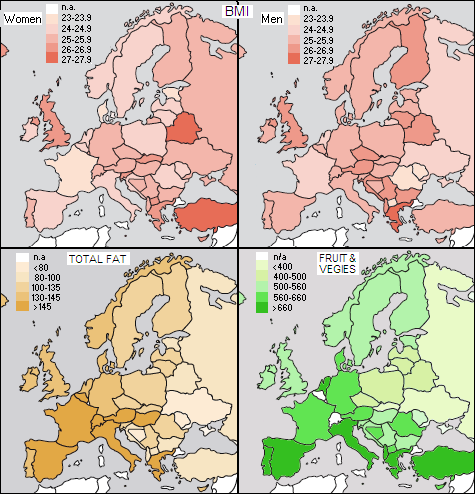
What is immediately apparent is the division between eastern and western part of the continent, with the central region in between being sort of a transition. In general, mortality is low in the Northern, Western and Southern Europe, intermediate in the Central Europe, and high in the Eastern Europe. Let's see how well this mortality distribution coincides with the obesity factor, total fat intake and intake of fruit and vegetables by the country.
Looking at these maps, what seems to be working well against CVD mortality is higher BMI (overweight/obesity) for men, and for all, higher intake of fats and fruits/vegetables. Except for the last, not quite in agreement with what the books say, at the first sight, but we can try to make some sense out of it. Noting that BMI does not directly and accurately indicate proportion of body fat, and that total fat intake is too crude a figure (not showing proportion of good-to-bad fats) to be an accurate indicator, we still can come to useful general conclusions. Countries with the lowest mortality for both, CHD and stroke, are France, Switzerland and Norway, with Spain and Italy coming close. What is keeping French at the lowest BMI level, knowing that their fat intake approaches 40% of total calories, more than half of it of animal origin (read: saturated)? The answer is probably that what really matters in obesity is not so much the fat percentage, but total caloric intake, and lifestyle. With the French in particular, not being a fan of highly processed foods, sodas, snacks, TV watching and computer games certainly helps. And it is not just about caloric total, either: average food glycemic index may matter even more. By raising blood glucose level, high-glycemic-index foods oversupply the cells, which in response burn less fat, storing it into fat tissues instead (this effect is well known limitation of the use of insulin shots in diabetes, which initially facilitate transfer of plasma glucose into the cells; weight gain is common side effect, and so is development of insulin resistance, requiring ever higher doses of insulin, resulting in more weight gain, and so on...). Needless to say, chronically elevated glucose levels are an invitation for diabetes, and related increase in the CVD risk. But how do the French manage to have the lowest rates of CVD consuming so much saturated fats, day in and day out? We've heard about red wine and resveratrol, but there's not just enough of it there to produce significant effect; wine's procyanidins, antioxidants protecting blood vessels, which also can help reduce cholesterol level and blood pressure, could have appreciable effect, but there's much more of them in chocolate and apples, for instance, than in wine (in case you've wondered how exactly fruit does it, that's one example). The answer is probably in what some recent studies indicate, that saturated fats are not harmful to cardiovascular health, even in moderate excess, as long as they are mainly natural - i.e. part of a diet of low-processed and unprocessed foods. The latter also implies no trans-fats, nutrient deprivation, chemical additives and other "goodies" coming with highly processed foods. Good intake of unprocessed vegetable fats (poly- and monounsaturated) enables the body to partly compensate for common deficiency in the essential fatty acids intake, known for their protective effect on cardiovascular system - so there we go. Apparently, it is the overall quality of a diet what matters more than the official set of numerical indicators - BMI, total fat intake, saturated fat intake or total cholesterol. If you give to the body what it needs to function/regenerate, it is only logical to expect that it will be stronger, more resistant to all diseases, including cardiovascular. And if you don't, chances are, you'll share the fate of Eastern Europe. Despite being either leaner than most of the rest of Europe (men), or near-average (women), and consuming the least amount of fat, their CVD mortality is skyrocketing. The absence of green is only one important factor. Excessive smoking among men is the other, and higher overall level of environmental contamination probably yet another. The fact that health care systems in these countries either nearly collapsed, or have become seriously deficient due to economic downturns and political chaos, certainly contributes - and significantly so - to the steep increase in their CVD mortality rates. Add to it a factor that hasn't made it into the official set of CVD risk factors, despite being more important than total cholesterol, or total fat intake per se: chronic stress and depression of life without means for decent living, sense of security and agreeable future. It all counts. Salt? Looks like we've lost track of it while focusing on what really matters. These worst faring countries CVD-wise probably have somewhat higher salt intake than the best countries average, but it is still within their salt intake range. At the same time, their CVD mortality is not only by several orders of magnitude higher, but also sharply increasing, contrary to these other countries. With a reasonable assumption that average salt intake hasn't changed significantly within the last couple of decades, there is simply no
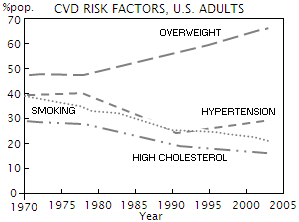
evidence of salt intake in this range Still, for the reasons explained earlier, the European cardiovascular disease statistics 2008 (and most other official documents on the subject of CVD) won't miss to mention salt intake as an important dietary factor in CVD mortality, specifically stating that it effects blood pressure. No numbers of any kind given, just keeps chasing the salt ghost. And then we have crusade against salt in a country like Portugal, which, quite unusually, has incidence of stroke significantly higher than that of coronary heart disease. It was probably only question of "when" will someone in the appropriate capacity step in and blame Portuguese's high salt consumption for it. That someone is Dr. Luis Martins, a member of Portuguese Society of Hypertension (closely associated with the World Action on Salt and Health, or WASH, an international organization promoting salt intake reduction), who now leads crusade against high salt intake in Portugal. It doesn't matter that the average Portugal's salt intake of ~12g/day is only marginally higher than, say, in Sweden or Switzerland, both in the lowest quintile for stroke incidence, with Portugal's blood pressure figures about midway between these two countries. Isn't that good enough indication that the main culprit is not their salt intake, but something else? Apparently not for those whose agenda is based on dogma and appropriately selective use of facts. And how do the U.S. CVD mortality rates and risk factor figures measure up against those in Finland? Graph below shows respective CHD death rates for 1970-2007 period, age-adjusted for the European Standard Population.
It clearly shows that Finland's heart disease death rates cut over the last three decades isn't exceptional when compared to the U.S. rates either. The U.S. stroke rates are in the long-term decline, with a decade of flattening between 1990 and 2000 (note that added stroke rates are adjusted to a different standard population than the CHD rates; thus the two are not strictly comparable, but the effect on the nominal values is minor). For comparison, the graph includes Japan and France, the two countries with the lowest CHD death rates and in the very top with respect to life expectancy. Their estimated respective salt consumptions are ~8 (INCA 2, 2008) and ~11g (Japan's Ministry of Health, Labor and Welfare), without salt added in cooking and at the table. There is no reliable estimate for the amount of added salt; it can be as little as ~20% of the total salt intake with diets of mainly processed (read: pre-salted) foods, up to 65% with more natural diets (Poland, Szybinski et al, 2010). Considering that neither French, nor Japanese diet are based on highly processed foods, it is not likely that their total salt consumption is less than ~10 and ~14g/day, respectively (the latter figure coincides with NIPPON DATA80 in Katsuyuki et al, 2010, but that figure is also approximate, based on food records estimates, not direct measurements), possibly somewhat more. This, of course, is not just directly contradicting the official salt hype, it is literally slap in its face. Not that they care. It is scary to think about the magnitude of power and deliberate manipulation needed to present to French people as a "scientific fact" that their salt intake is a major threat to their cardiovascular health, or to the Americans that they need to significantly reduce their own - which, at ~9g/day, is already below the French intake level - in order to lessen their cardiovascular problem. The truth is, Americans are already doing great without any salt intake reduction (the likely factors behind it are left as an exercise to the reader). One has to wonder, is this newest push for dietary salt intake reduction the way out for the governmental health organizations in developed countries (primarily) to take advantage of the long-term downward CVD mortality trends, and settle collision of their long advocated low-salt policies with the facts without major embarrassment, by crediting lower salt intake for the (likely) future decline?
Of course, steady decline in smoking is a big plus (unlike nearly irrelevant total cholesterol). More efficient medical treatments, as well as better health/dietary education and control of environmental pollution are also contributing to this decline. At the end of this lengthy overview - which is still only a scratch on the surface of the labyrinth of CVD-related facts and factors, what emerges with the strength of evidence is that there is a number of important CVD-related factors at the level of population - some officially recognized, some not - and that the present dietary salt intake in Western countries is not one of them. Summing it all up, available evidence clearly indicates that biological response to either elevated or reduced sodium intake level varies individually. According to Overlack et al. studies, roughly 60% of the general population is likely to be unaffected within the range of intake as wide as 1-17g of salt a day, between 20 and 25% are salt-sensitive in that this wide intake differential induces moderate (single-digit) blood pressure increase, and the rest are salt-sensitive in exactly the opposite way - reacting to higher salt intake with a moderate blood pressure drop. Based on these numbers, variations in salt intake of up to a few grams above and below the U.S. average of ~9g a day are unlikely to cause significant changes in blood pressure for the majority of people. A 6-12g daily salt intake (2.4 to 4.8g, or 100 to 200 mmol of sodium) should be generally the safe range; salt intake outside this range, either higher or lower, cannot be generally recommended. This directly implies that the present salt intake in the U.S. is not significantly related to the rate of hypertension at the level of population. Consequently, a population-wide salt-intake reduction would have little effect in lowering the hypertension rate. If so, what is the most effective course of action for addressing this problem? That is a subject of the final article. YOUR BODY ┆ HEALTH RECIPE ┆ NUTRITION ┆ TOXINS ┆ SYMPTOMS |
||||||||||||||||||||||||||||||||||||||||||||||||||||||||||||||||||||||||||||||||||||||||||||||||||||||||||||||||||||||||||||||||||||||||||||||||||||||||||||||||||||||||||||||||||||||||||||||||||||||||||||||||||||||||||||||||||||||||||||||||||||||||||||||||||||||||||||||||||||||||||||||||||||||||||||||||||||||||||||||||||||||||

 For
there are certainly more important issues to tackle, than salt. It
is interesting, and somewhat puzzling, that the downward CVD
mortality trend in the U.S. still unfolds against two decade long
increase in the proportion of overweight Americans (BMI>25), and decade
long increase in the rates of hypertension, defined as blood
pressure exceeding 140/90 (left, ages 35-74; source: NHANES/NHIS).
For
there are certainly more important issues to tackle, than salt. It
is interesting, and somewhat puzzling, that the downward CVD
mortality trend in the U.S. still unfolds against two decade long
increase in the proportion of overweight Americans (BMI>25), and decade
long increase in the rates of hypertension, defined as blood
pressure exceeding 140/90 (left, ages 35-74; source: NHANES/NHIS).