|
■
Home ■ site map |
||||||||||||||||||||||||||||||||||||||||||||||||||||||||||||||||||||||||||||||||||||||||||||||||||||||||||||||||||||||||||||||||||||||||||||||||||||||||||||||||||||||||||||||||||||||||||||||||||||||||||||||||||||||||||||||||||||||||||||||||||||||||||||||||||||||||||||||||||||||||||||||||||||||||||||||||||||||||||||||||||||||||||||||||||||||||||||||||||||||||||||||||||||||||||||||||||||||||||||||
|
|
BLOG: June 2010 - December 2013 II - Mammography
4. Mammography
defense
|
|||||||||||||||||||||||||||||||||||||||||||||||||||||||||||||||||||||||||||||||||||||||||||||||||||||||||||||||||||||||||||||||||||||||||||||||||||||||||||||||||||||||||||||||||||||||||||||||||||||||||||||||||||||||||||||||||||||||||||||||||||||||||||||||||||||||||||||||||||||||||||||||||||||||||||||||||||||||||||||||||||||||||||||||||||||||||||||||||||||||||||||||||||||||||||||||||||||||||||||
| 2 good choices to prevent breast cancer | |||
|
III - ALTERNATIVE TESTS |
|||
|
▪
The biggest
risk factor |
END OF A MYTH |
OTHER
X-RAY TESTS |
|
|
OTHER TESTS |
|||
|
▪
False negative ▪ False positive ▪ Overdiagnosis |
|||
|
PROMOTING FACTORS ▪ Hormonal ▪ Non-hormonal |
RADIATION |
▪
Radiation primer ▪ Screen exposure ▪ Radiation risk |
|
|
PHYSICAL
EXAM ▪ Clinical ▪ Self-exam |
|||
Vitriolic reaction to the Gøtzsche and Olsen's end-of-the-century dismissal of the conventional mammography screening as ineffective and unjustified wasn't surprising. Though they were not the first to blow the whistle, what they have started - and kept going up to this day - did have a deep impact, shifting the paradigm and the way that public mammography screenings are perceived and practiced.
Of course, the pro-mammography camp wouldn't just let go: too much was at stake.
A study that challenged findings threatening the life-saving image of mammography screening brought up a hypothesis that most breast cancer studies, including Olsen and Gøtzsche's, have fundamental methodological error in assessing the effectiveness of mammography screening. The error is, according to them, in neglecting that, due to the relatively long period between breast cancer detection and death, effectiveness of mammography would begin to show only
after a certain time lag.
In other words, assuming that women screened by mammography will be diagnosed, on average, at an earlier stage, their treatment will be more successful, and mortality lower - but that won't be evident within the first few years of monitoring. This new twist was offered as an explanation for the absence of tangible benefit from mammography screening in no-benefit trials: study authors contended that, since no previous study controlled this factor, they all have shown mammography screening as less beneficial than it really is.
Following this hypothesis - which originates at least two decades back (Analysis of the temporal patterns of benefits in the Health Insurance Plan of Greater New York trial by stage and age, Chu and Connor, 1991) - study authors picked the Malmo trial and found that mortality reduction in the screened population 55-69 years of age does show upswing toward the end of follow up period, reaching 55% in the period 8-11 years after randomization (Mammographic screening: no reliable supporting evidence?, Miettinen et al. 2002).
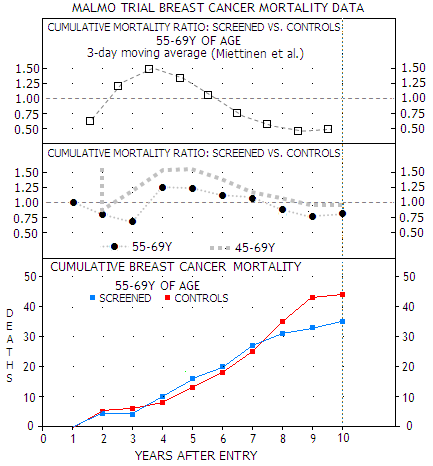
Miettinen
et al. statistical manipulation
(TOP) of the actual data
(MIDDLE, BOTTOM) for the older subgroup of women in the
Malmo trial, showing 20% mortality reduction for the
screened population at study end. For both, older and
younger women, however, mortality rate is mainly higher for the
screened population in this period (MIDDLE), due to even
higher mortality among screened population in the 45-54Y group
(not shown). Considering relatively small number of deaths,
these results are subject of possibly significant random
statistical variations.
Since Malmo trial was one of the two that passed as sufficiently reliable in the Danes' study, this methodological correction proves that mammography does save lives, even more so than what was thought before.
Or does it? The study chooses to use relative mortality rates based on the moving average of the actual annual deaths (as a 3-year average, dropping the oldest year as it moves to the next 3-year period). Plots above hint at why Miettinen et al. replaced the direct mortality ratio between screened and control group (middle) with the uncommon 3-day moving average (top). The latter gives about twice lower relative mortality (55% vs. 22%) for screened population toward trial's end; it also shifts the second mortality turning point, from the excess to reduction, sooner.
This is critically important for the lag hypothesis, since authors decided to interpret the delay period as one determined by the mortality ratio dropping below one for screened population. With the 3-day average it occurs nearly 6 years after entry, which is already too long a period to be supported by real-life data. The direct average places it even farther away, nearly 8 years from entry, making it even more unrealistic.
What Miettinen et al. method does
was
jokingly compared to the Texas sharpshooter who draws a target
around the bullet hole (Bonneux, Lancet correspondence 2002).
They picked the trial, then they picked the screened population
subgroup, and then they picked the time interval that suited
their theory. Screened study population as a whole had
insignificant 4% mortality reduction, with the screened women aged
45-54y
having 29% higher, and those 55-69y 20% lower mortality than controls.
That leaves us with pretty unclear picture of what the numbers would look like for the conventional >50 years of age group.
The larger numbers later in the study are more statistically reliable, but not to the point of making mortality differential due to random clustering of deaths impossible, or even improbable.
Does the actual Malmo data really support the point of the
delayed benefit of mammographic screening on breast cancer
mortality reduction? It is potentially
crucial aspect of the controversy, so let's take a look.
|
MORTALITY
FIGURES FOR BC DIAGNOSED WOMEN (45-69years at entry) |
|||||||||||||||||||||
|
POPULATION |
r |
All |
ALIVE |
DEAD |
|||||||||||||||||
|
Breast Cancer |
Other causes |
||||||||||||||||||||
|
Stage |
All |
Stage |
All |
Stage |
All |
||||||||||||||||
|
0 |
1 |
2 |
3 |
4 |
0 |
1 |
2 |
3 |
4 |
0 |
1 |
2 |
3 |
4 |
|||||||
|
Screened |
at screening |
1 |
374 |
60 |
221 |
58 |
2 |
- |
341 |
1 |
4 |
6 |
1 |
- |
12 |
- |
16 |
4 |
1 |
- |
21 |
|
between |
2 |
100 |
24 |
27 |
22 |
2 |
- |
76* |
- |
4 |
9 |
5 |
2 |
20 |
- |
2 |
2 |
- |
- |
4 |
|
|
non-attendees |
3 |
107 |
7 |
16 |
32 |
6 |
3 |
65* |
- |
1 |
6 |
7 |
17 |
31 |
1 |
5 |
3 |
2 |
- |
11 |
|
|
Total |
4 |
581 |
91 |
264 |
112 |
10 |
3 |
482 |
1 |
9 |
21 |
13 |
19 |
63 |
1 |
23 |
9 |
3 |
- |
36 |
|
|
Control
group |
5 |
444 |
48 |
151 |
130 |
14 |
7 |
350 |
1 |
5 |
28 |
9 |
22 |
66* |
1 |
6 |
14 |
4 |
3 |
28 |
|
|
Total treated+control |
6 |
1025 |
139 |
415 |
242 |
24 |
10 |
832 |
2 |
14 |
49 |
22 |
41 |
129 |
2 |
29 |
23 |
7 |
3 |
64 |
|
|
column # |
1 |
2 |
3 |
4 |
5 |
6 |
7 |
8 |
9 |
10 |
11 |
12 |
13 |
14 |
15 |
16 |
17 |
18 |
19 |
||
BC=breast cancer *slight sum discrepancy in the study table
The table shows distribution of mortality in breast cancer patients in the screened vs. control population, broken down to breast cancer stages, with 0 being the detected pre-malignant growths (ductal or lobular carcinoma in situ) and 4 the most advanced forms.
Looking at the Malmo trial data, there was +43, +117, -25, 0 and +7 differential in the total of diagnosed cancers in screened vs. control group for stages 0, 1, 2, 3 and 4, respectively. It clearly indicates that screening does help detect suspicious growth earlier, with nearly all of the extra cancers detected being at stage 0 and 1. But that itself does not necessarily - and seems as it usually does not - translate into significant mortality reduction.
It should be noted that the data is only for women diagnosed with breast cancer. Thus "other causes" refers to causes of death in these women other than breast cancer. All deaths in the trial, including those from breast cancer, are given in the following table:
|
All deaths in the Malmö trial until December 31. 1985. |
||
|
CAUSE OF DEATH |
SCREENED |
CONTROLS |
|
MALIGNANT TUMORS (BREAST CANCER) |
707 (63) |
739 (66) |
|
CARDIOVASCULAR DISEASES |
721 |
673 |
|
RESPIRATORY DISEASES |
97 |
111 |
|
GASTROINTESTINAL DISEASES |
47 |
44 |
|
UROGENITAL DISEASES |
16 |
20 |
|
INJURIES, SUICIDE, UNKNOWN |
100 |
120 |
|
OTHER |
89 |
102 |
|
TOTAL DEATHS |
1777 |
1809 |
Evidently, breast cancer deaths were a small fraction (~3.5%) of the total deaths in the study population. The differences between two groups with respect to total mortality are also relatively small, without statistical significance. With the accidental, unknown and unspecified deaths left out, the
total mortality differential is a single death.
It should be noted that the control group had nearly 4% higher all-cancer mortality, but 9% lower heart disease mortality. The latter, at least in part, could be related to overtreatment within the screened population, particularly radiation, which is known to negatively affect heart and blood vessels.
The trial used conventional breast cancer staging classification. Expectedly, survival rates vary with the extent and form of a disease. In order to estimate the magnitude of delay in mortality reduction due to screening, study numbers can be combined with stage-based prognostic figures.
There are numerous possible sources for such figures. We'll use one based on the actual set of data, which is also within the usual range, and as good for the purpose as any (West Midlands, UK, 1990-94 diagnoses, followed up to 2004; note that these figures are for conventionally treated breast cancer cases).
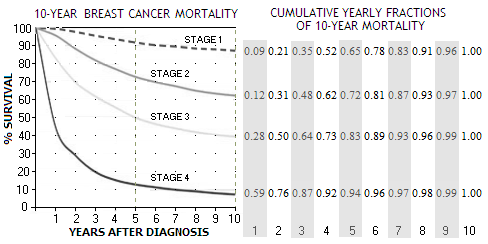
It shows that mortality for all four stages - stage 1 being the least, and stage 4 the most advanced form - is significantly higher in the first 5 years after diagnosis, starting to flatten out toward the 10-year mark. The not shown stage 0, a pre-malignant breast cancer form (ductal or lobular carcinoma in situ), has 5-year survival rate of 98% (somewhat optimistic, because it doesn't account for recurrent cancers). Most carcinomas in situ do not develop into a cancer.
According to these plots, 5-year mortality rates are about 9%, 27%, 50% and 86% for stages 1, 2, 3 and 4, respectively. During another 5 years, mortality rates increasingly slow down, reaching cumulative 13%, 37%, 61% and 92% (in the same order) at the end of 10-year period. Nominal differences in mortality rates between the stages are very significant, but the differences in yearly rates
nearly vanish after 10 years.
In other words, nearly the entire mortality differential between the stages is contained within the first 10 years from diagnosis, with the differences in mortality rate after that becoming negligible.
Number of deaths resulting from cancers detected within the first year that will fall out of the 9-year trial period is determined by the 9th year fraction (at right from the plot), for cancers detected in the second year by the 8th year fraction, and so on, ending with the number of deaths from the last, 9th year that fall into the trial period approximated by the 1st year fraction (so, some 97% of the deaths from stage 2 cancers detected the 1st year will occur within the 10-year period, while only about 12% from this stage cancers detected the 9th year).
Obviously, the Malmo screening group was not homogeneous, with significant number of detected cancers in it being "interval" cancers (detected between screenings), and among non-attendees. But this is, more or less, the reality of screening, which cannot be assumed to have neither perfect attendance, nor accuracy. Vice versa, non-screened population is always to some extent "contaminated" with opportunistic screening.
In effect, the comparison is
between the population of women that agreed to
screening,
and the one that did not,
not between two populations of which one is entirely screened and the other with zero screening.
The disproportionally high breast cancer incidence and mortality among non-attendees and interval cancers groups within the screened population strongly suggests that even trial populations of this size are still
too small to extract reliable
statistical data for such a
low-incidence event as breast
cancer.
Such random statistical swings in the mortality ratio between screened and unscreened group are to expect, considering the very low mortality rate, and relatively few deaths (in this particular trial, the mortality rate was about 0.3%, nearly identical for the two groups, or 66 and 63 total deaths - approximately 7 deaths a year - within either of the two groups of over 21,000 women each).
All considered, any analysis of these data can produce indicators at the best, rather than facts, or evidence. But that is what is available, so let's see how significant is, in this trial, the mammography benefit lag that causes some saved lives to fall out of the study period.
Applying yearly mortality fractions
(at right on the 10-year mortality plot above) to the trial's 9-year differential
per breast cancer stage (0 stage being omitted since with near-zero death
rate; with the same approach, it would result in a single death
within the trial period, zero outside) gives this proportion of breast cancers that can be
expected to fall within the 9-year trial period vs. those that
would occur after study end gives the following:
|
Breast cancer deaths falling out of 10-year period (estimate) |
||||||||||
|
STAGE |
SCREENED |
CONTROLS |
||||||||
|
CANCERS |
MR |
DEATHS |
CANCERS |
MR |
DEATHS |
|||||
|
Total |
IN |
OUT |
Total |
IN |
OUT |
|||||
|
1 |
+113 |
13 |
15 |
9 |
6 |
- |
13 |
- |
- |
- |
|
2 |
- |
37 |
- |
- |
- |
+28 |
37 |
10 |
6 |
4 |
|
3 |
- |
61 |
- |
- |
- |
+4 |
61 |
2 |
2 |
0 |
|
4 |
- |
92 |
- |
- |
- |
+4 |
92 |
4 |
4 |
0 |
|
TOTAL |
113 |
- |
15 |
9 |
6 |
36 |
- |
16 |
12 |
4 |
MR = 10-year mortality rate (for simplicity, being nearly identical to the 9-year rate)
The whole idea of the delayed benefit of screening
for mortality reduction is that women diagnosed at a later stage -
more numerous in unscreened populations - will have higher mortality
rate, but it will effectively show only after those women that will
die actually pass away. And if significant portion of these deaths takes place outside the study
"window", the benefit can be lost. What the numbers show is that this
unaccounted for hidden benefit is marginal at best in the Malmo trial
(9-year duration):
only about 6 deaths within the screened population would occur after trial end, nearly offset by 4 post-trial-period deaths in the control (unscreened) group.
Considering the fact that breast cancers in the control group are generally diagnosed at more advanced stage, even if generally somewhat later, than in the screened group, makes it highly unlikely that there would be any significant lag effect selectively favoring breast cancer death rate in the control group.
Consequently, Miettinen et al. mortality dynamics producing 55% mortality ratio reduction for the last period in a 3-year moving average is much more likely to be a result of tailoring statistical method to selected data, in order to extract desired numerical outcome based on random sequence variations, than representative of an actual statistical (i.e. average, or expected) mortality dynamics. Even if placed in the context of the "mortality reduction lag" for standard mammography, it is not based on the actual effect. It belongs to the domain of "statistical fiction".
This simplified estimate of the mortality lag effect is not strictly accurate numerically - which is of little consequence considering uncertainties related to the trial data itself - but suffices to indicate the magnitude of "mortality lag" effect: nothing to write home about. It also indicates that the Malmo trial data for breast cancer incidence and mortality are within generally established trends.
But some other implications, left out by the Miettinen et al., as well as other X-ray mammography screening advocates, are potentially significant. If we look at the total number of breast cancers detected, even after 9 years the screened population still has an excess of 134, or 30% more detections than control group. It is to expect that screening, capable of detecting breast cancer earlier, will have higher number of detections initially. But it
should nearly even up within 2-3
years, as those undetected early cancers in unscreened
population become large enough for
off-screening detection.
In other words, the excess of breast cancers detected at an earlier stage in the screened population should be nearly offset by an excess of later-stage cancers detected with some delay within unscreened population. Most of the delay due to the absence of mammography screening is the time needed for breast cancer to advance from stage 1 to stage 2. The pace at which this occurs varies individually, from months to years. On the average, it is probably one to two years.
Even assuming that mammography detects 50% more breast cancers a year, initially, and that unscreened population nearly catches up in three years (which is not what really happens in the real world, due to a significant number of cancers detected by screening mammography being pseudo-diseases that would remain asymptomatic), after 9-year period the screened population would still have
less than 10% excess in the total number of diagnosed cancers.
What the 30% more diagnosed breast cancers in the screening group after 9 years in the Malmo study indicates is that more than 20% of "breast cancers" detected by mammography during this trial had
never developed into a real cancer!
This "overdiagnosis" rate directly indicates the rate of "overtreatment" (a fancy word for unnecessary, or unjustified treatment) that the trial's screened population was exposed to. This ghostly excess of detected cancers in the screened population is not an exception of the Malmo trial - it is a pattern consistent in both, trials in general and actual screening practice.
Another worrisome pattern creeping through all major breast cancer randomized controlled trials on the effect of the standard X-ray mammography screening, beginning with the very first (HIP), is the
higher mortality among screened population for the first several years of screening, particularly in women below age 50.
It is present in the Malmo trial as well, as the above graph illustrates. Often referred to as "mortality paradox", it still awaits for an explanation.
Yet another unflattering, brushed aside pattern common to the standard mammography trials is that the total mortality is not lower in the screened populations. In fact, screened population diagnosed with breast cancer in the Malmo trial had higher total mortality: 99 vs. 94 among the breast cancer diagnosed unscreened population. Obviously, it is directly related to the respective sizes of the two groups, with the 36 vs. 28 "other cause deaths", respectively, being nearly in the same proportion with the total of diagnosed cases in each population.
But if we look at the disease-caused deaths in the Malmo trial, they are practically identical for screened and unscreened populations. Even in the trials that produce nominally appreciably lower breast cancer mortality for the screened population, more often than not it is offset by the higher mortality from other diseases in this group.
Regardless of what is behind this statistics, it is certainly a piece of information that every woman should know before deciding whether or not to use standard X-ray mammography screening for breast cancer.
YOUR BODY ┆ HEALTH RECIPE ┆ NUTRITION ┆ TOXINS ┆ SYMPTOMS